Sample Excel Dashboard for SharePoint Online
Yesterday I wrote about tips for showing Excel dashboards in SharePoint Online.
With File Viewer web part you can display Excel dashboards in your SharePoint Online sites. There are some gotchas you need to be aware though. This post gives an example of an original dashboard and its optimized for SharePoint Online version.
Here are two sample Excel dashboards that you can use to check that functionality:
- Original Excel dashboard—test performance dashboard based on pivot tables and charts.
- Excel dashboard optimized for SharePoint Online—dashboard modified to work in SharePoint Online.
The second dashboard contains the following modifications:
- Blocks with charts and slicers are ungrouped, otherwise filters won’t work;
- Background image removed as it’s not supported online;
- Map chart removed as it’s not supported online;
- Charts made smaller to reduce scrolling (the area up to cell R29 is shown without scrolling in a one column layout);
- Removed header “Performance Dashboard” to save up space.
After modifications, I’ve got the following result:
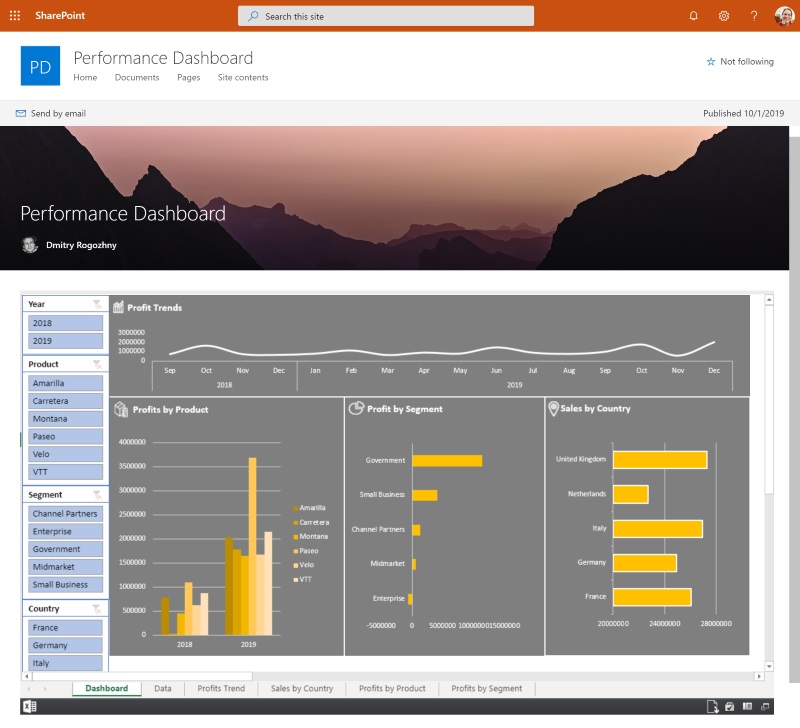
I’ve used the financial sample workbook from Mircorsoft for demo data.