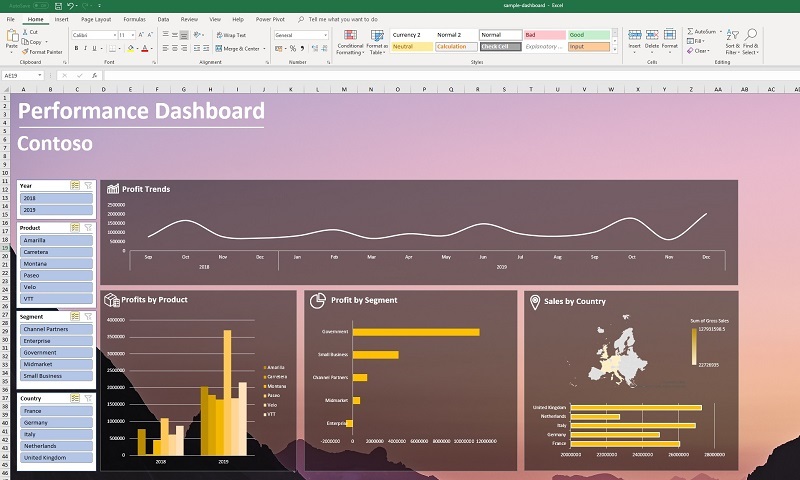
5 Tips for Showing Excel Dashboards in SharePoint Online
Excel is a great choice for creating dashboards. It provides lots of features to visualize your data. In SharePoint Online you can show dashboards directly in pages, making information easier to find. This is a great way to enhance your intranet and team sites.
Here are 5 tips to keep in mind when adding Excel dashboards to your SharePoint Online sites.
1. Use a single File Viewer web part per page
You’ll be using the File Viewer web part for displaying Excel dashboards in SharePoint Online.
Here are some recommendations:
- Create a separate page for your dashboard—do not mix Excel dashboard with other information. This way you’ll have more space for your dashboard.
- Avoid using multiple File Viewer web parts on a page—this will increase a page load time and will add more scrolls to a page.
- Use a simple one column layout—this will allow to display more information without scrolling.
2. Test your dashboard features
Not all desktop Excel features are available online. That is why it’s important to test your dashboard features. You can check the web service description for a list of supported features and learn more about the differences between desktop and online.
In most cases, it is easier to test the feature you need live to make sure that there are no caveeats, rather than reading through the documentation.
3. Avoid scrolling in your dashboards
Depending on page size and layout there is a limit on the information that will be visible to users without scrolling. It is advisable to use one column layout for your dashboard, as it will allow to show the maximum amount of data without scrolling.
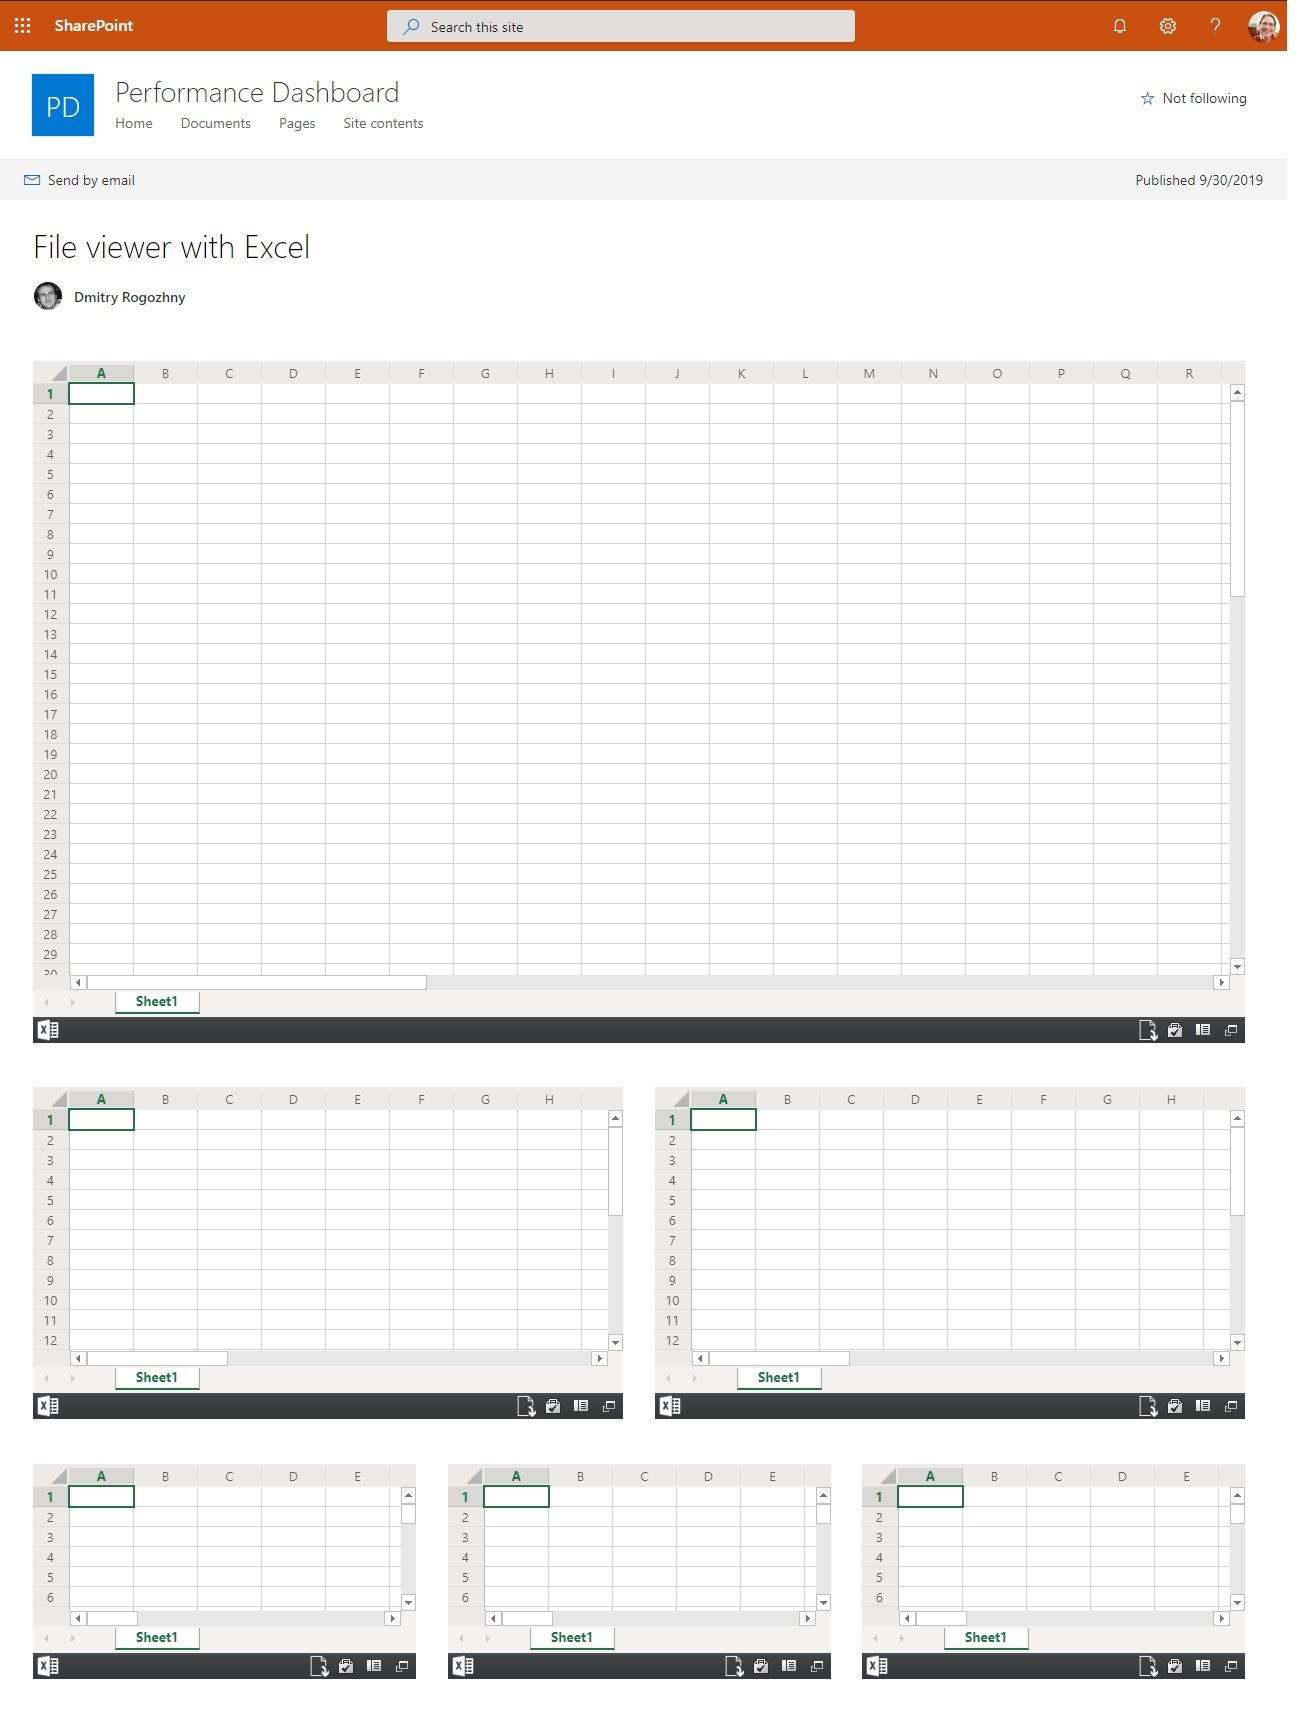
Here is the max cell in an Excel workbook visible without scrolling:
- One column layout—R29;
- Two columns—H12;
- Three columns—E6.
4. For simple dashboards consider using Text and Quick Chart web parts
Consider using simple Text and Quick Chart web parts instead of Excel dashboard in the following cases:
- Your data is not dynamic and got changed manually.
- You don’t need additional sorting, filtering, and slicing of data.
- You want to place a dashboard on a home page or other page with mixed content.
- Page load time and visual crispness is a priority (no scrolls, complex layout on a page, etc.).
5. For complex dashboards consider using Power BI
In some cases, you may consider using Power BI platform instead of Excel dashboard. SharePoint Online provides the Power BI web part that allows to show data from the Power BI platform. It is more complex and time consuming to set up reports and dashboard in Power BI, but you’ll get more features and better web support.
One more thing to keep in mind is that you would need additional Power BI licenses to be able to share a dashboard in SharePoint Online. Here’s more information on embedding Power BI reports in SharePoint Online.